

Analyses of macromolecules from cell systems are targeted by sequencing and mass spectrometry, and can be implemented at different levels of resolution. Cell Signaling and Communication Integrated Platform (CSC) capabilities emphasize single cell variability or small group population phenotypes.
Proteomics
Analyses of macromolecules from cell systems are targeted by sequencing and mass spectrometry, and can be implemented at different levels of resolution. CSC capabilities emphasize single cell variability or small group population phenotypes. Proteomics experimental design captures protein expression at single-cell resolution with the unique sample processing pipeline on a chip called nanodroplet processing in one pot for trace samples (nanoPOTS).
nanoPOTS is a novel nanosampling preparation platform that utilizes microfluidics and robotics to profile limited biological and environmental samples as small as a single cell. This novel sampling technology is coupled with our custom automated injector to enable high-throughput single-cell and spatial proteomics. Currently, the nanoPOTS platform has identified and quantified 2–4K proteins from dissociated single cells or a small number of microdissected cells from tissue sections.
Review the steps for the proteomics experimental design process.
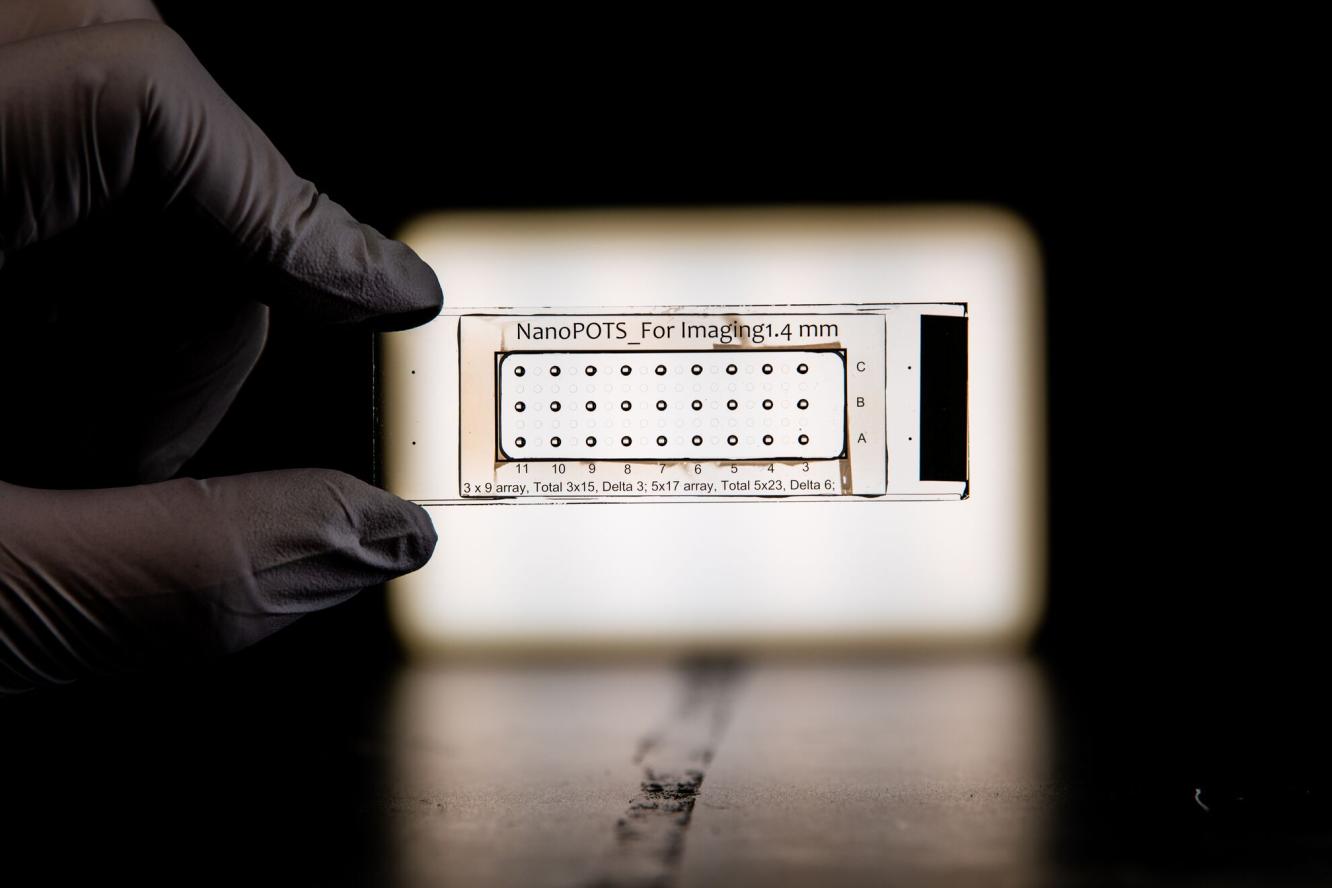
Nanodroplet Processing in One Pot for Trace Samples (NanoPOTS) is a novel nanosampling preparation platform that utilizes microfluidics and robotics to profile limited biological and environmental samples as small as a single cell. This novel sampling technology is coupled with our custom automated injector to enable high-throughput single-cell and spatial proteomics. Currently, the nanoPOTS platform has identified and quantified 2–4K proteins from dissociated single cells or a small number of microdissected cells from tissue sections.
Cell Isolation
- Sort cells by cellenONE (nanoSPLITS, isobaric Labeling N2 Chip)
- Sort by fluorescence-activated cell sorting (FACS)
- Sample tissues by laser capture microdissection (LCM)
NanoPOTS Chip Deposition
- Deposit samples on a nanofabricated glass chip
- Calibrate sample sizes for <50 ng of protein per sample injection
- Choose the diameter of the nanowell by sample size and type
- Process samples in one pot for optimal sample recovery
nanoPOTS Autosampler LC
- Load processed sample chip with novel injection system
- Compatible with all nanoPOTS chips
- Automated
- Use reversed-phase HPLC with nanoflow columns to introduce samples to mass spectrometer
Mass Spectrometry Data Acquisition
- Collect data with high-resolution Orbitrap Fusion Tribrid Lumos
- Data-dependent acquisition (DDA) or -independent acquisition (DIA)
- Use field asymmetric-waveform ion-mobility spectrometry to increase the resolution of complex samples
- Use the high-sensitivity Bruker trapped ion mobility spectrometry time of flight instrument for single-cell proteomics
Transcriptomics
Transcriptomics experimental design captures mRNA responses at a range or resolution from populations to single cells, including bulk library preparation, leveraging cell selection and subpopulation sorting, and successive barcoding of cell pools with transcript library generation inside the cell container during split-pool ligation-based transcriptome sequencing (splitSEQ).
Access the workflow steps for each specific transcriptomics experimental design process.
Sequencing the collection of RNA transcripts produced by a cell population provides insights into environmental responses, coordinated regulation of genes and proteins, and population heterogeneity.
1. SAMPLE PREP & RNA ISOLATION
- Harvest cell suspensions or cultures by centrifugation and flash freeze at −80°C
- Isolate RNA using variable approaches (total RNA for prokaryotic samples, poly(A) for eukaryotic)
- For complex environmental samples, additional steps are included (e.g., power-soil kit)
2. COMPLEMENTARY MDNA LIBRARY PREPARATION
- For total RNA samples, deplete rRNA using
- Illumina® Ribo-Zero Plus Microbiome rRNA depletion kit
- NEBNext® rRNA depletion Kit (bacteria)
- Use reverse transcription to synthesize cDNA with oligo-dT and random hexamer primers
- Fragment transcripts and select size depending on the sample
- Attach barcode adapters, amplify, and purify library
3. DATA ACQUISITION AND ANALYSIS
- Illumina sequencing (5–20 million reads per sample for isogenic samples, 50–200 million reads per sample for mixed populations/consortia)
- Check read quality with FastQC, quality and adapter trim using the bioinformatics package BBDuk, align reads to genome using bowtie2 (prokaryotes) or STAR (eukaryotes), map to genes using FeatureCounts. Store results on Aurora and upload to the EMSL User Portal (NEXUS).
- Carry out differential expression analysis using the bioinformatics package DEseq2
- If needed, network analysis using the Seidr suite
Sequencing the collection of RNA transcripts produced by a cell population provides insights into environmental responses, coordinated regulation of genes and proteins, and population heterogeneity.
1. Sample Prep & RNA Isolation
- Isolate single cells or subpopulations by fluorescence-activated cell sorting, liquid chromatography–mass spectrometry, or cellenONE
- Eukaryotic sorting available
- Bacterial sorting in development
- If needed, store samples at −80°C prior to RNA extraction
- Isolate RNA using variable approaches (total RNA for prokaryotic samples, poly(A) for eukaryotic)
2. cDNA Library Preparation
- For total RNA samples, deplete rRNA using
- Illumina® Ribo-Zero Plus Microbiome rRNA depletion kit
- NEBNext® rRNA depletion kit (bacteria)
- Use reverse transcription to synthesize cDNA with oligo-dT and random hexamer primers
- Fragment transcripts and select size depending on the sample
- Attach barcode adapters, amplify, and purify library
3. Data Acquisition and Analysis
- Illumina sequencing (5–20 million reads per sample)
- Check read quality with FastQC, quality and adapter trim using BBDuk, align reads to genome using bowtie2 (prokaryotes) or STAR (eukaryotes), map to genes using FeatureCounts. Store results on aurora, upload to Nexus
- Carry out differential expression analysis using DEseq2
- If needed, network analysis using the Seidr suite
1. Cell Harvesting and Permeabilization
- Harvest cell suspensions/cultures (by centrifugation) and fix in a 4% PFA solution. At minimum, 2×10⁶ cells are needed
- Permeabilize cells with a lysozyme–Tween 80 treatment
2. Single-Cell Barcoding
- Aliquot cells into 96-well plates, each well containing primers with a unique barcode
- Carry out in-cell RT barcoding
- Repeat pooling and barcoding 2–3 times to achieve single-cell resolution
3. cDNA Library Prep
- All cells are pooled and cDNA isolated by biotin–streptavidin, followed by proteinase K digestion to remove the cross-links
- Select the size of the cDNA library and attach barcode adapters
- Carry out ribosomal cDNA depletion (CAS9-assisted DASH or RNase H protocols)
- Amplify depleted library
4. Data Acquisition and Analysis
- Illumina sequencing (400 million reads per sample)
- Check read quality with FastQC, quality and adapter trim using BBDuk, align to genome, map to reads and cell calling with STARsolo. Store results on aurora, upload to Nexus
- Clustering, visualization, and differential expression using Seurat
Related Publications
Gaisser KD, Skloss SN*, Brettner LM, Paleologu L, Roco CM, Rosenberg AB, Hirano M, DePaolo RW, Seelig G, Kuchina A. High-throughput single-cell transcriptomics of bacteria using combinatorial barcoding. Nat Protoc. 2024 Jun 17. doi: 10.1038/s41596-024-01007-w. Epub ahead of print. PMID: 38886529.
Kuchina A, Brettner LM, Paleologu L, Roco CM, Rosenberg AB, Carignano A, Kibler R, Hirano M, DePaolo RW, Seelig G. Microbial single-cell RNA sequencing by split-pool barcoding. Science 17 Dec 2020: 10.1126/science.aba5257
https://www.nature.com/articles/s41596-024-01007-w/figures/1