
Computing, Analytics, and Modeling
Enhanced Software Yields More Reliable Results for Biomolecular Analysis
The software package pmartR helps scientists delve down into biological samples to better identify the structure and function of biomolecules.

Scientists have created a unified pipeline for data-processing steps that promotes valid statistical choices that yield reproducible and more reliable results on which to base decisions. (Image by Freepik)
The Science
Scientists use analytical tools to characterize and quantify the structure and function of molecules from biological samples. A particular challenge when conducting these analyses is understanding how differences in data types and the technologies used require scientists to use appropriate and valid statistical analysis strategies. A publicly available and specialized software package called pmartR now ensures high-quality data analysis and visualization. The developers recently enhanced the software to include more technologies and interactive data visualization, making the package useful for a larger audience. The enhanced software creates a standardized statistical pipeline of data that allow scientists to visualize and identify changes in biological molecules over time.
The Impact
When scientists study biological samples—such as those from plants being considered to provide clean energy or human tissue needed for disease diagnosis and treatment—they use advanced instruments like mass spectrometry. After scientists match study results to reference databases to identify proteins and metabolites, they use software programs to filter those data, remove outliers, and normalize the data to prepare them for further analysis. The pmartR software package creates a unified pipeline for these data-processing steps and ensures the quality of the data, thereby promoting valid statistical choices that yield reproducible and more reliable results on which to base decisions.
Summary
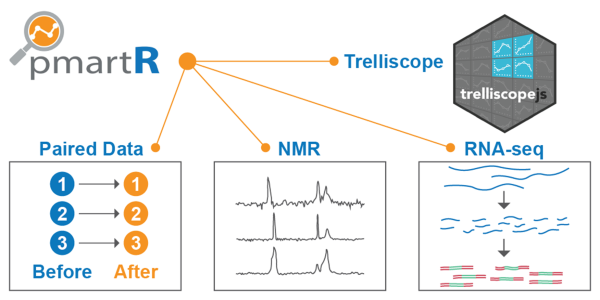
Scientists from Pacific Northwest National Laboratory originally designed the pmartR software for the quality control and analysis of mass spectrometry data, tailored to the specific characteristics of data from proteins, metabolites, and lipids. Based on requests from the scientific community, the developers used statistical analysis techniques to add several enhancements. One was the ability to provide quality control and analysis of data from nuclear magnetic resonance (NMR) spectroscopy, which is used by several laboratories, such as EMSL, the Environmental Molecular Sciences Laboratory, a U.S. Department of Energy (DOE) Office of Science user facility. Another enhancement was an interactive visualization framework to help identify trends out of what is often huge volumes of data from mass spectrometry or NMR systems. A third was the ability to analyze RNA sequencing data. At the same time, scientists expanded the statistics and visualization capabilities. Overall, these new capabilities have extended the functionality of the package. This advance in the software delivers on the vision of a single source of analysis code for quality control and statistics of all biomolecular data, a source that evolves and adapts as new technologies arise.
Contact
Lisa Bramer, Pacific Northwest National Laboratory, lisa.bramer@pnnl.gov
Funding
Funding for this work was provided by EMSL, the Environmental Molecular Sciences Laboratory, a DOE Office of Science user facility.
Publications
D.J. Degnan, et al., “pmartR 2.0: A quality control, visualization, and statistics pipeline for multiple omics datatypes.” Journal of Proteome Research 22, 570-576 (2023). [DOI: 10.1021/acs.jproteome.2c00610]